My openEHR CDR was 15x slower than the competition... or so I thought

A week ago I noticed my openEHR Clinical Data Repository (CDR) felt a bit sluggish. Naturally, I benchmarked it against EHRbase.
The results were brutal:
❌ My CDR: 15 ms to commit a composition
⚡ EHRbase: 1 ms
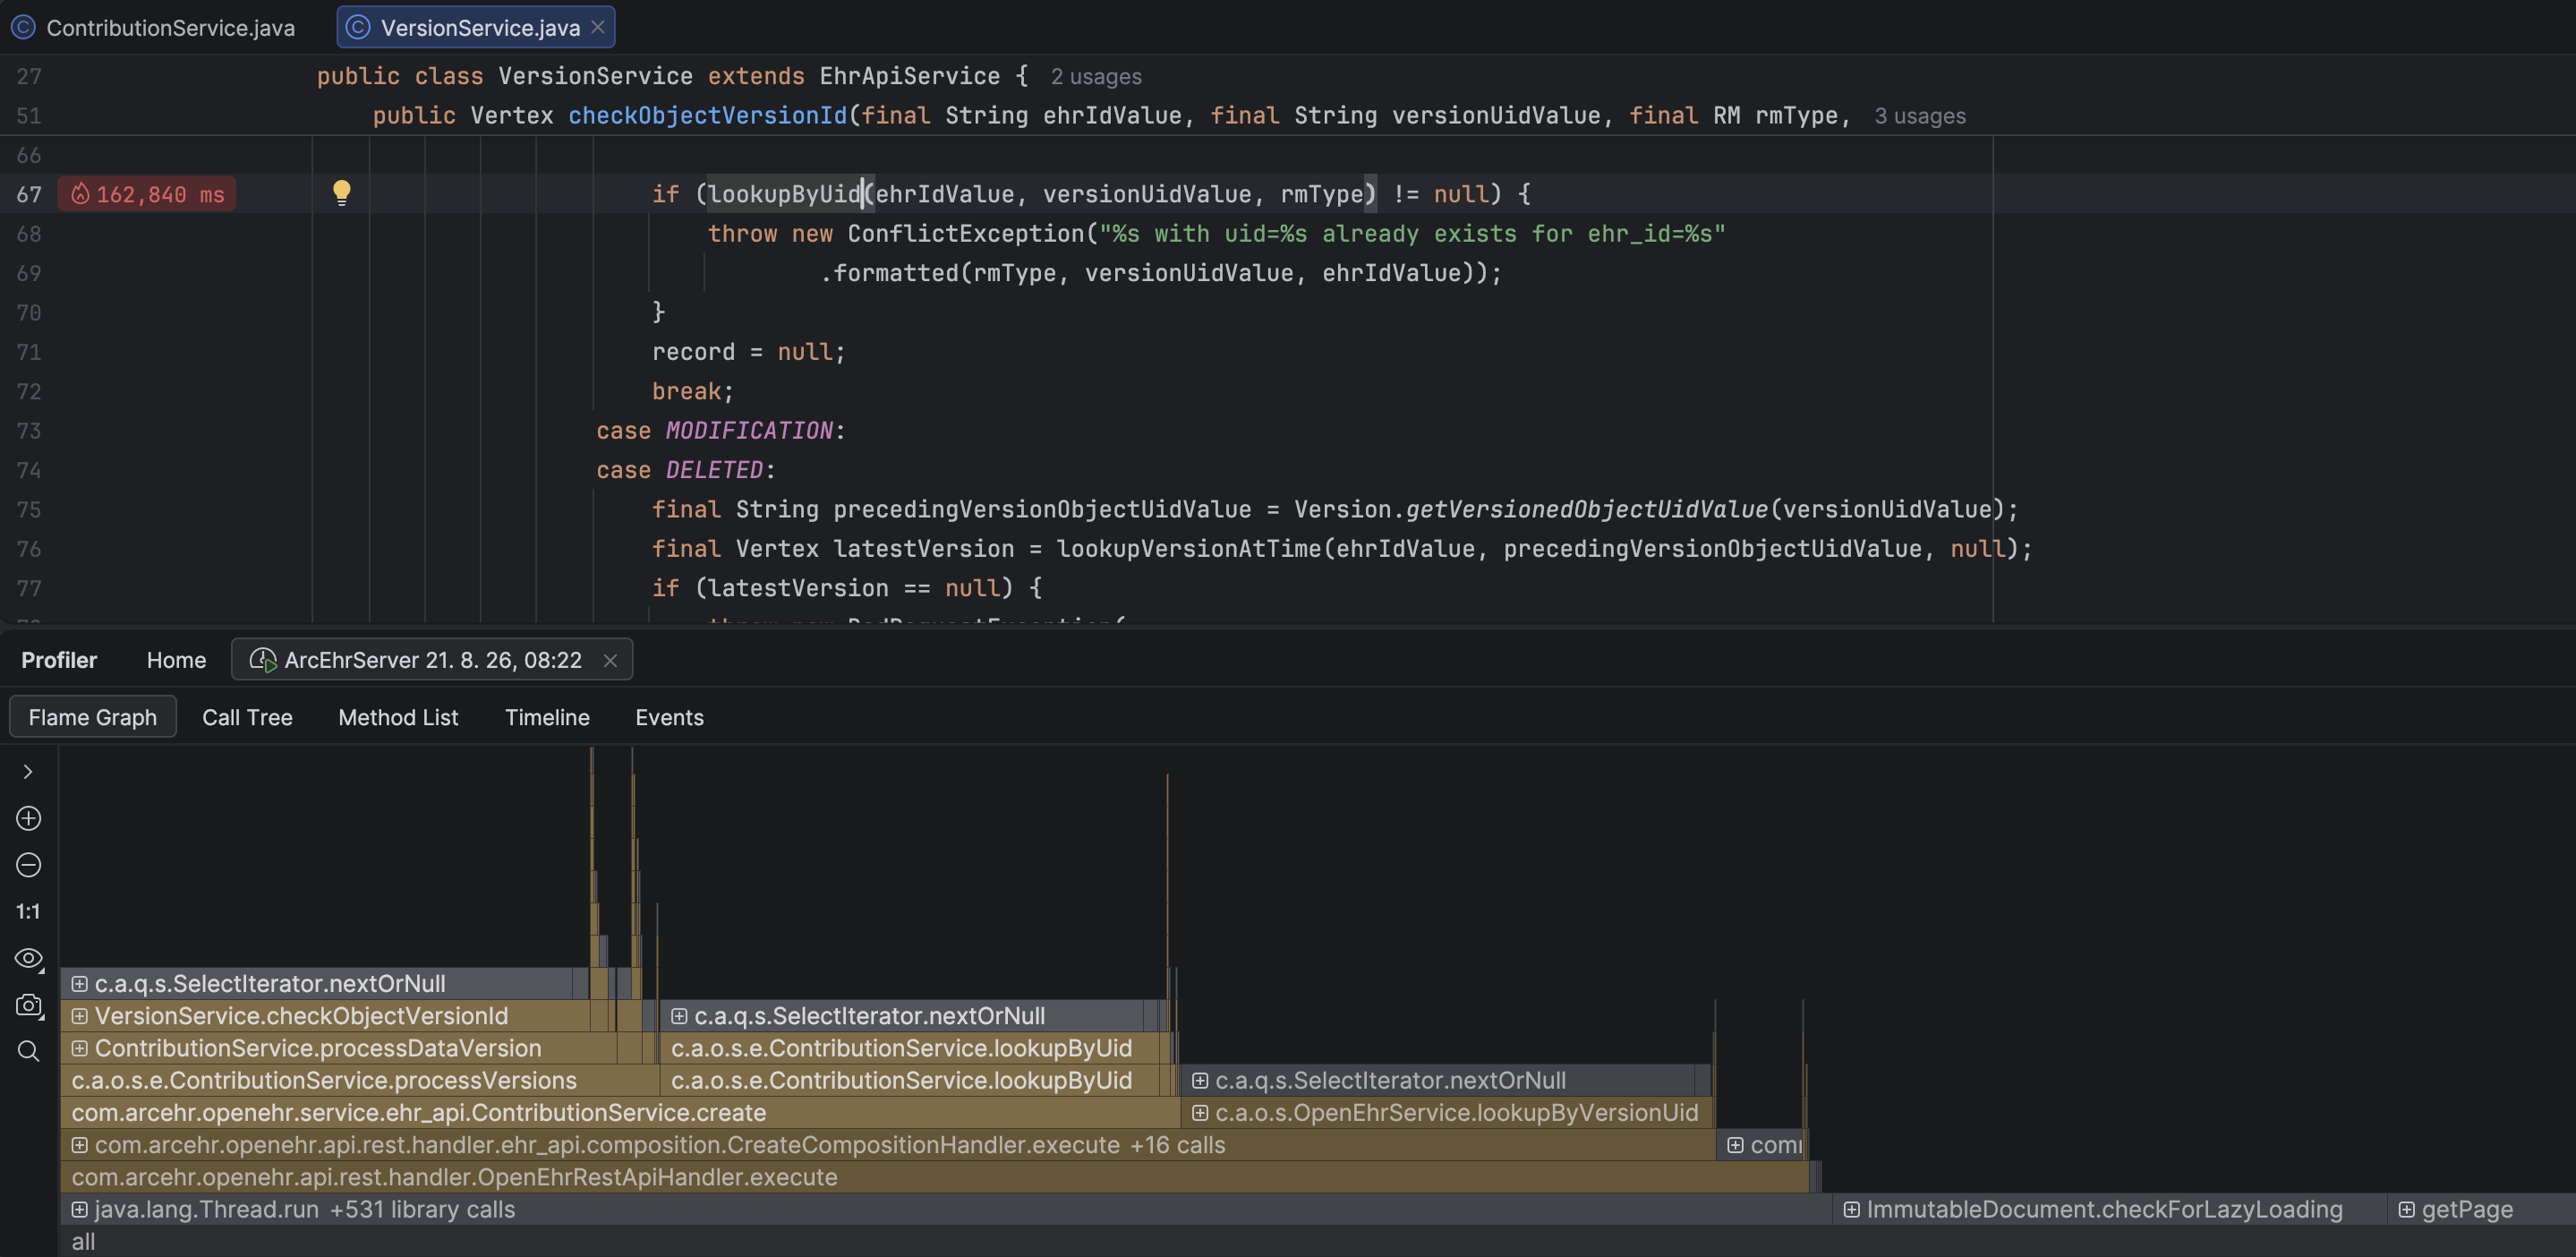
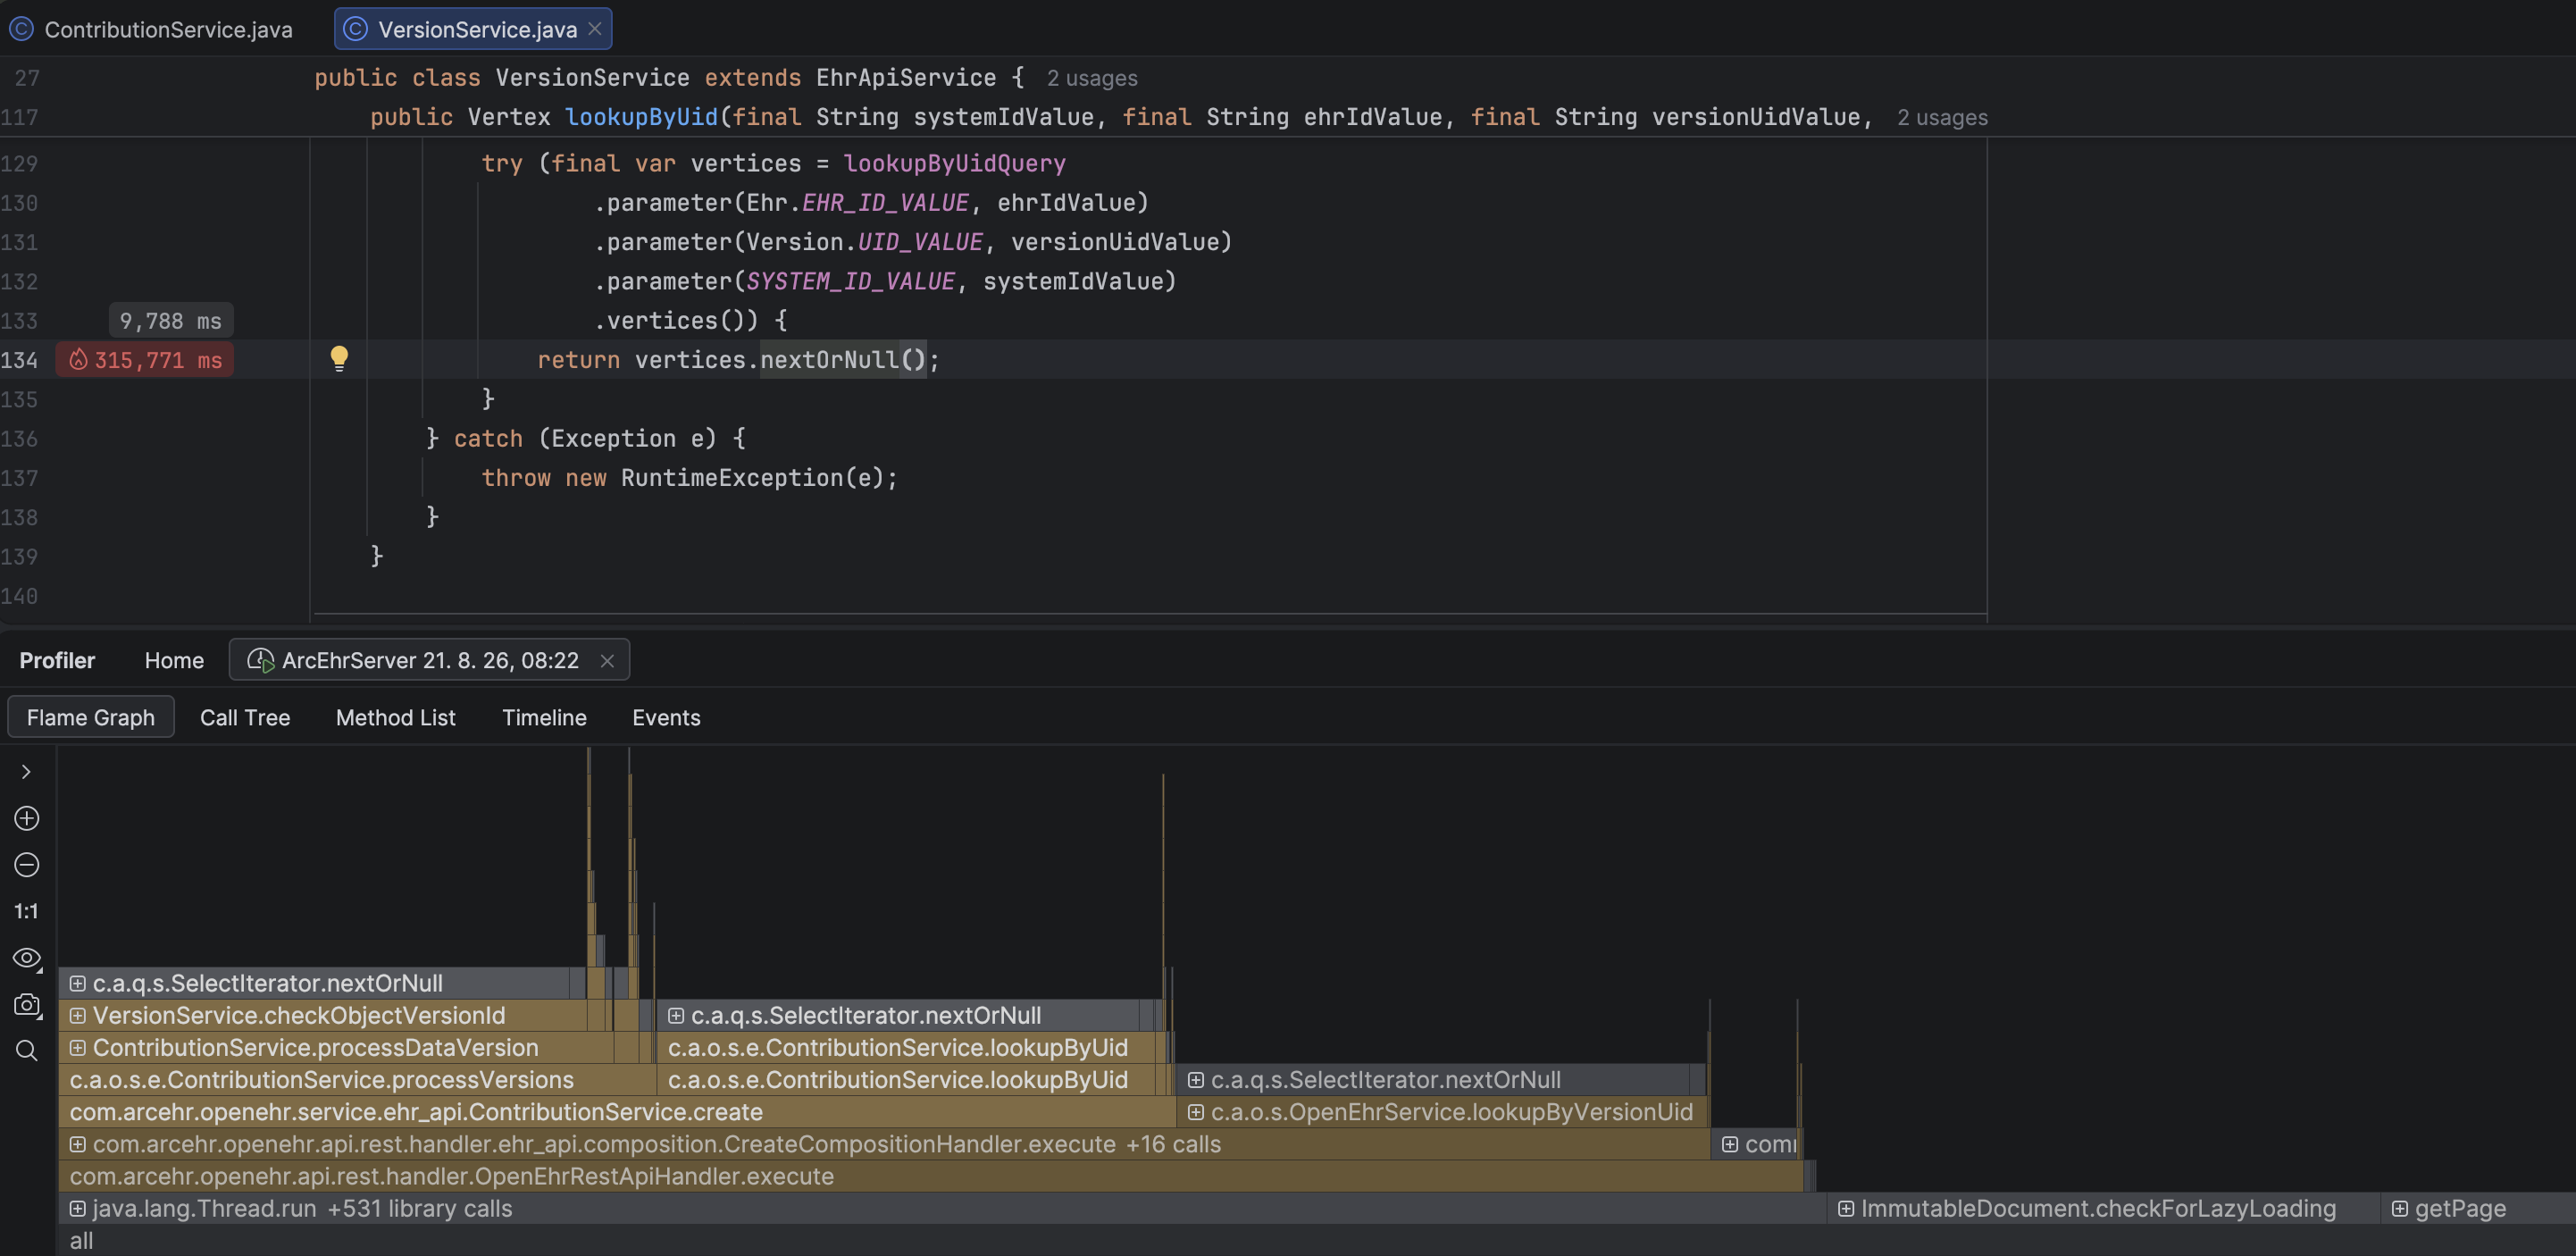
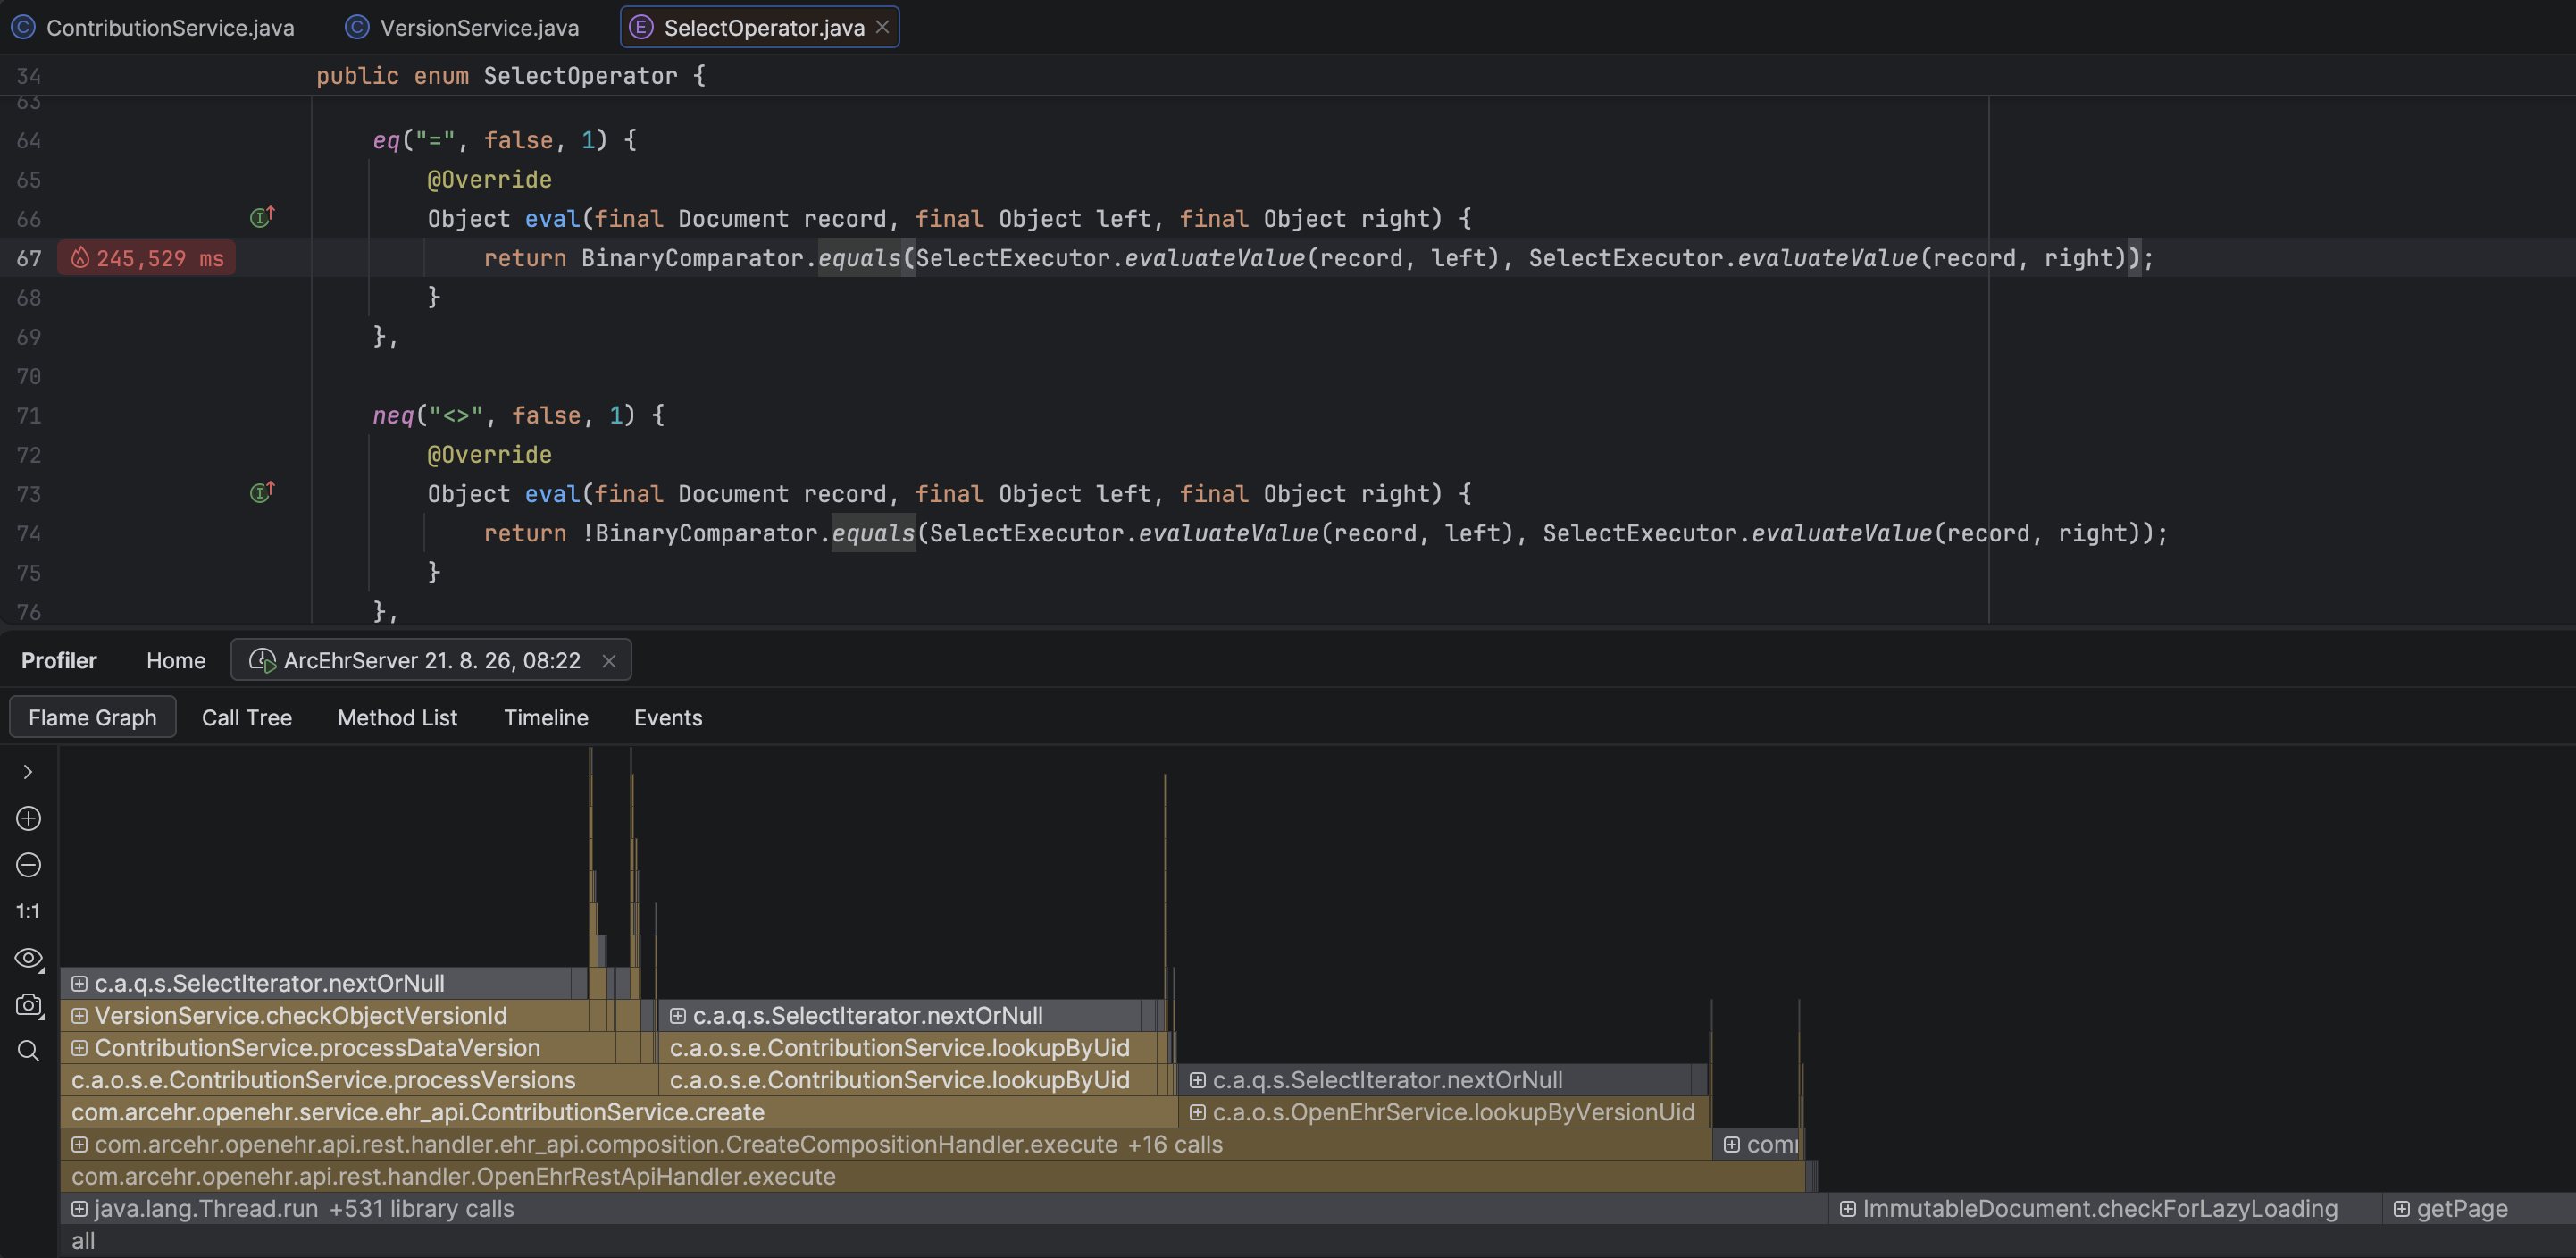
Humble pie served. I immediately went down the profiling rabbit hole to figure out where my architecture was bleeding performance. After two days of profiling, I accepted that the best I could do with my CDR was 6 times slower than EHRbase.
Fast forward to today: I started benchmarking read performance. To do that, I needed the UIDs of the inserted EHRs and compositions. But EHRbase wasn't returning them in the response body.
That’s when the dominoes started falling:
- I was expecting openEHR REST API 1.1.0 responses, but EHRbase follows 1.0.2 (which returns UIDs in the ETag response header).
- While investigating responses, I noticed something strange: EHRbase was also returning errors on every single EHR creation.
- The issue? EHRbase expects an EHR_STATUS with PERSON, whereas the latest spec example uses PARTY_SELF.
The plot twist: That 1 ms benchmark wasn't committing compositions at lightning speed. It was just reporting creation errors in record time. The contributions were never actually processed. 😂
Once I fixed the payload and reran the benchmarks properly:
🐢 EHRbase real speed: 9.62 ms
⚡ My optimized CDR: 4.43 ms
The first test involves creating 100 EHRs, each with 1000 compositions. I’m using an 885-line Vital signs composition to make the test realistic:
| Total mm:ss | per composition | |
|---|---|---|
| EHRbase | 16:02 | 9,62 ms |
| ArcEHR | 7:22 | 4,43 ms |
The second test is querying the compositions using all seven different ways to use the GET COMPOSITION endpoints (700k queries):
| Total mm:ss | per composition | |
|---|---|---|
| EHRbase | 30:55 | 18,56 ms |
| ArcEHR | 4:31 | 2,72 ms |
I’m running this on my 5-year-old Apple M1 Pro with 16 GB RAM, while simultaneously running 3 IDEs and Docker.
Moral of the story: Always check your HTTP status codes before you start questioning your entire architecture.