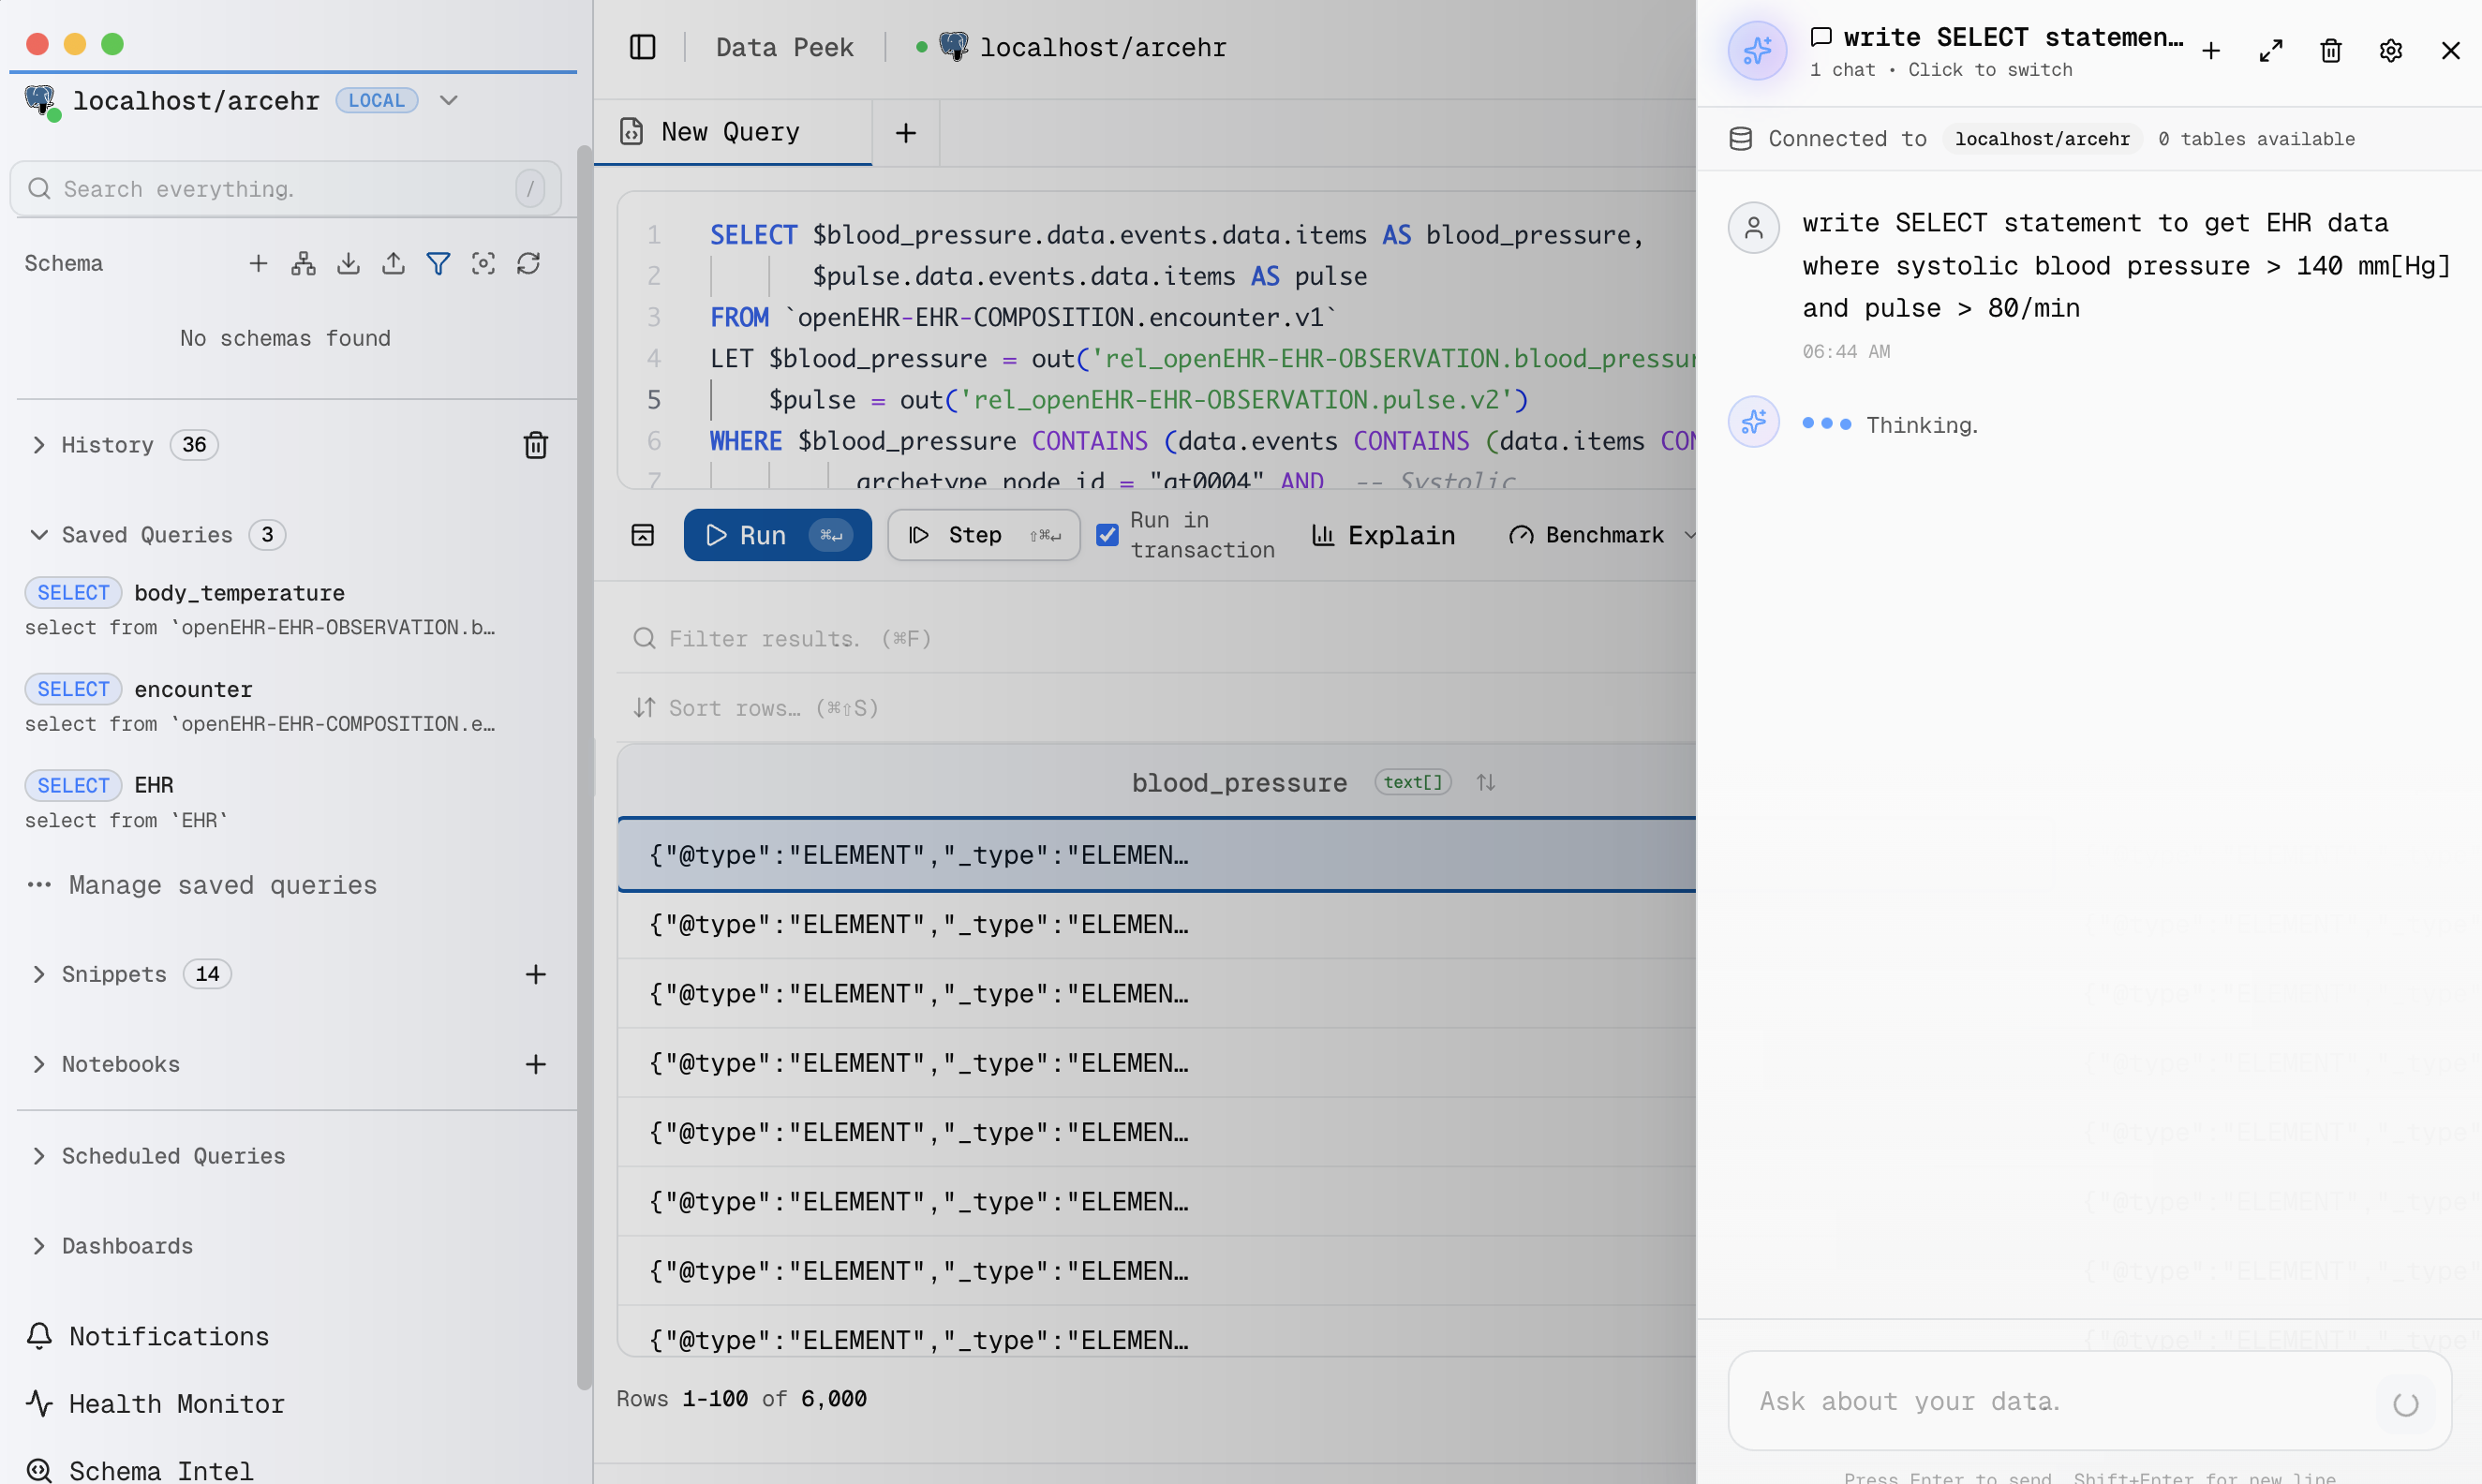
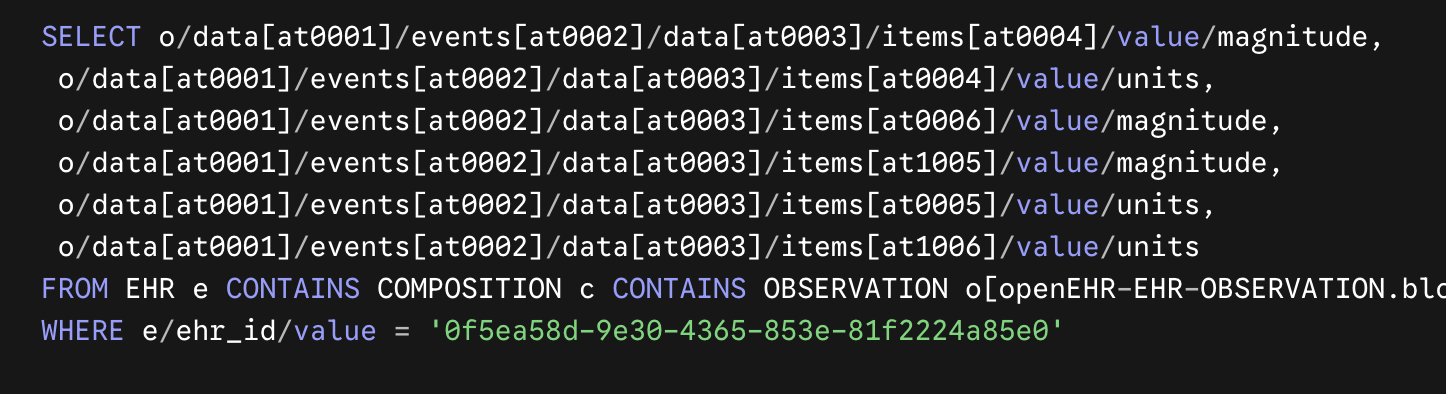
Tired of AQL to fetch openEHR data?

Traditionally, querying hierarchical and deeply nested openEHR Reference Model (RM) data requires using AQL (Archetype Query Language).
In ArcEHR, we map the openEHR Reference Model directly to a graph database using ArcadeDB. It also comes with a free and open-source data browser ArcadeDB Studio.
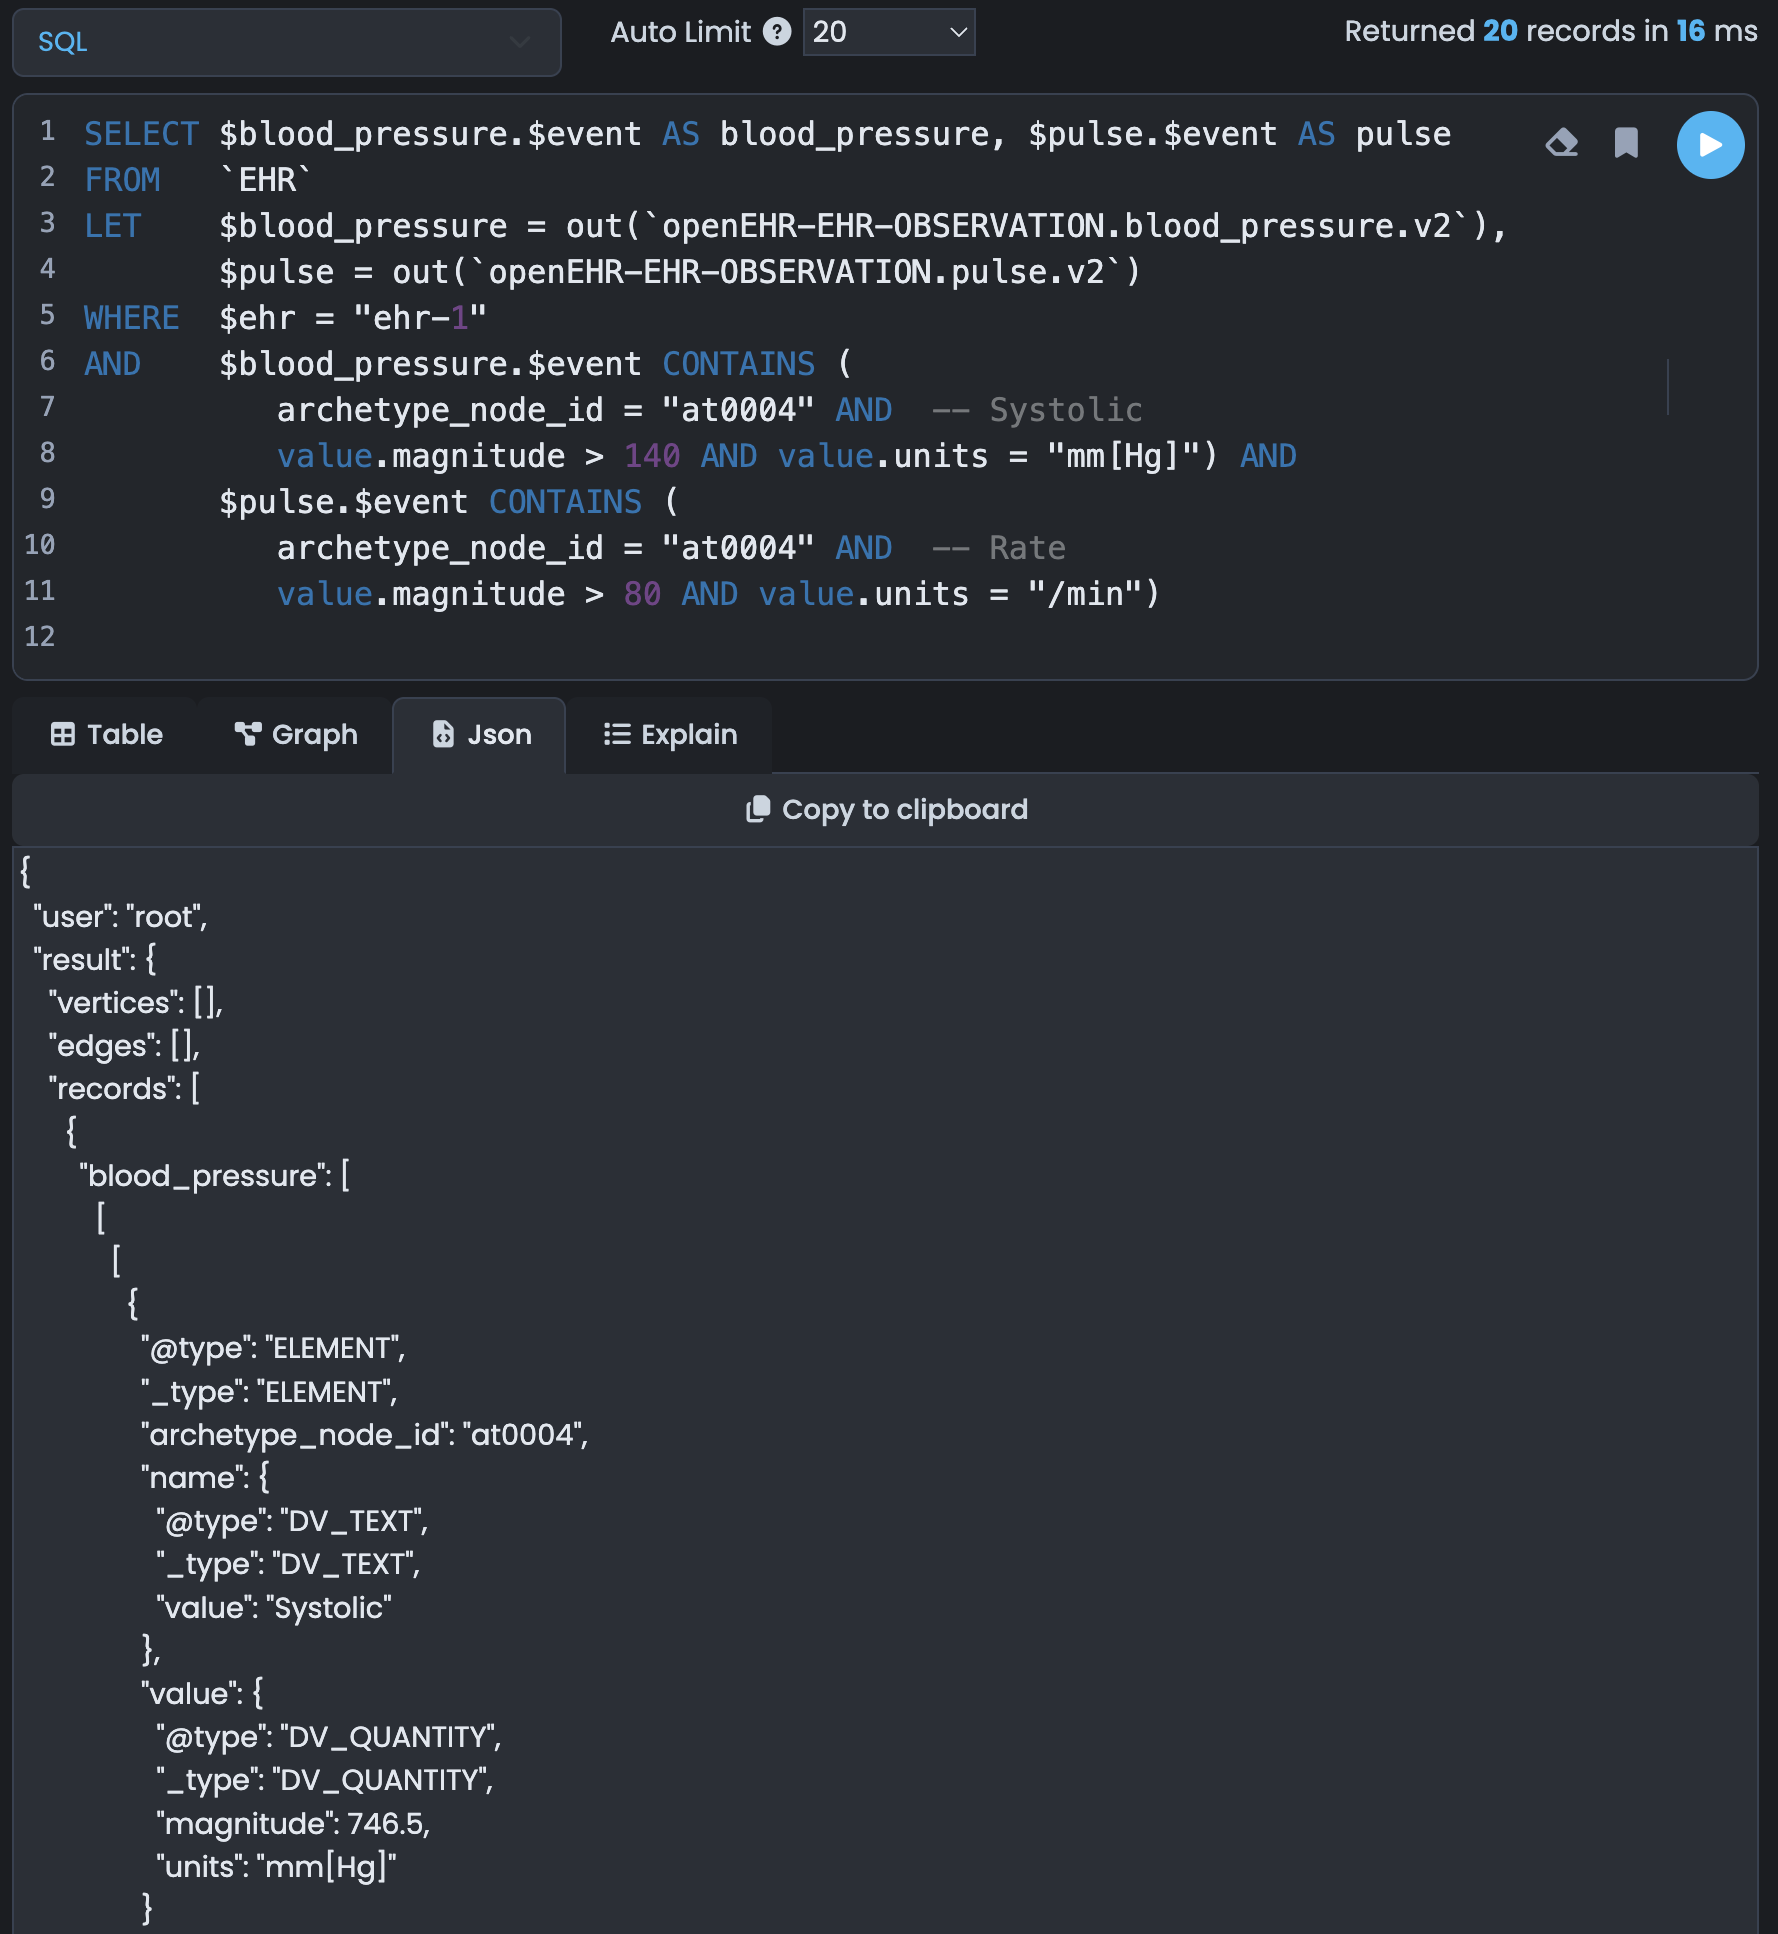
Best of all? You can still query and manipulate this graph data using standard SQL through any PostgreSQL GUI client or library.
Here is a quick look at how INSERT and SELECT work under the hood.
You can use your preferred PostgreSQL client to work with the ArcEHR database.
Developers can use their preferred PostgreSQL library to work with the ArcEHR database.
Inserting openEHR Data
To insert openEHR data, we use a simple SQL INSERT statement targeting the create_composition table. Behind the scenes, a database trigger automatically processes this payload, shredding the JSON and storing the composition directly into RM Document nodes and relationship edges.
INSERT INTO create_composition (ehr_id, content) VALUES ("ehr-1", {
    "archetype_node_id": "openEHR-EHR-COMPOSITION.encounter.v1",
    "name": {"value": "Vital Signs"},
    "uid": {"_type": "OBJECT_VERSION_ID", "value": "8849182c::openEHRSys.example.com::1"},
    "archetype_details": {
        "archetype_id": {"value": "openEHR-EHR-COMPOSITION.encounter.v1"},
        "template_id": {"value": "Example.v1::c7ec861c-c413-39ff-9965-a198ebf44747"},
        "rm_version": "1.0.2"
    },
    "language": {"terminology_id": {"value": "ISO_639-1"}, "code_string": "en"},
    "content": [{"_type": "COMPOSITION"}]
})
The schema of our create_composition table strictly mirrors the openEHR REST API, keeping integration painless.
| Field | Type | Required | Default | Allowed values |
|---|---|---|---|---|
ehr_id | STRING | Mandatory | — | — |
prefer | STRING | Optional | return=minimal | return=(representation|minimal|identifier) |
accept | STRING | Optional | application/json | application/(json|xml) |
content_type | STRING | Optional | application/json | application/(json|xml) |
openehr_item_tag | ARRAY | Optional | - | — |
openehr_version_item_tag | ARRAY | Optional | - | — |
content | STRING | Mandatory | — | — |
Querying openEHR Data (Zero Joins Needed)
Because this is a graph database, we use the database's native out() function to traverse edges. To find all blood pressure records for an EHR or Composition, we simply traverse the corresponding edge. No JOINs, no performance degradation as your dataset grows.
Scenario A: Simple SELECT with One Archetype
Let’s fetch the blood pressure data for a specific EHR:
SELECT $blood_pressure.$event AS blood_pressure
FROM   EHR
LET    $blood_pressure = out(`openEHR-EHR-OBSERVATION.blood_pressure.v2`)
WHERE  $ehr = "ehr-1"
Result:
{
  "blood_pressure": [[[
    {"_type": "ELEMENT", "archetype_node_id": "at0004",
      "name": {"_type": "DV_TEXT", "value": "Systolic"},
      "value": {"_type": "DV_QUANTITY",
        "magnitude": 140.5,
        "units": "mm[Hg]"
      }
    },
    {"_type": "ELEMENT", "archetype_node_id": "at0005",
      "name": {"_type": "DV_TEXT", "value": "Diastolic"},
      "value": {"_type": "DV_QUANTITY",
        "magnitude": 80.1,
        "units": "mm[Hg]"
      }
    }
  ]]]
}
Scenario B: Querying Multiple Archetypes with Filters
What if we want both blood pressure and pulse for a patient, filtered by specific clinical thresholds?
We can leverage the CONTAINS operator to traverse and filter nested collections in a single, readable query:
SELECT $blood_pressure.$event AS blood_pressure, $pulse.$event AS pulse
FROM   EHR
LET    $blood_pressure = out(`openEHR-EHR-OBSERVATION.blood_pressure.v2`),
       $pulse = out(`openEHR-EHR-OBSERVATION.pulse.v2`)
WHERE  $ehr = "ehr-1"
  AND  $blood_pressure.$event CONTAINS (
          archetype_node_id = "at0004" AND  -- Systolic
          value.magnitude > 140 AND value.units = "mm[Hg]")))
  AND  $pulse.$event CONTAINS (
          archetype_node_id = "at0004" AND  -- Rate
          value.magnitude > 80 AND value.units = "/min")))
This returns a clean, structured JSON object containing both clinical data points simultaneously—without a single SQL JOIN:
{
  "blood_pressure": [[[
    {"_type": "ELEMENT", "archetype_node_id": "at0004",
      "name": {"_type": "DV_TEXT", "value": "Systolic"},
      "value": {"_type": "DV_QUANTITY",
        "magnitude": 140.5,
        "units": "mm[Hg]"
      }
    },
    {"_type": "ELEMENT", "archetype_node_id": "at0005",
      "name": {"_type": "DV_TEXT", "value": "Diastolic"},
      "value": {"_type": "DV_QUANTITY",
        "magnitude": 80.1,
        "units": "mm[Hg]"
      }
    }
  ]]],
  "pulse": [[[
    {"_type": "ELEMENT", "archetype_node_id": "at0004",
      "name": {"_type": "DV_TEXT", "value": "Rate"},
      "value": {"_type": "DV_QUANTITY",
        "magnitude": 83.7,
        "units": "/min"
      }
    }
  ]]]
}
Developer Tooling
If you want to visualize your graph traversals, you can use the open-source ArcadeDB Studio browser to run and analyze your queries visually. Or, simply stick to your favorite PostgreSQL client and libraries — ArcEHR speaks PostgreSQL natively.